Table and Plots
You can include tables and plots generated in R. Such as these from the standard R markdown page.
summary(cars)## speed dist
## Min. : 4.0 Min. : 2.00
## 1st Qu.:12.0 1st Qu.: 26.00
## Median :15.0 Median : 36.00
## Mean :15.4 Mean : 42.98
## 3rd Qu.:19.0 3rd Qu.: 56.00
## Max. :25.0 Max. :120.00Including Plots
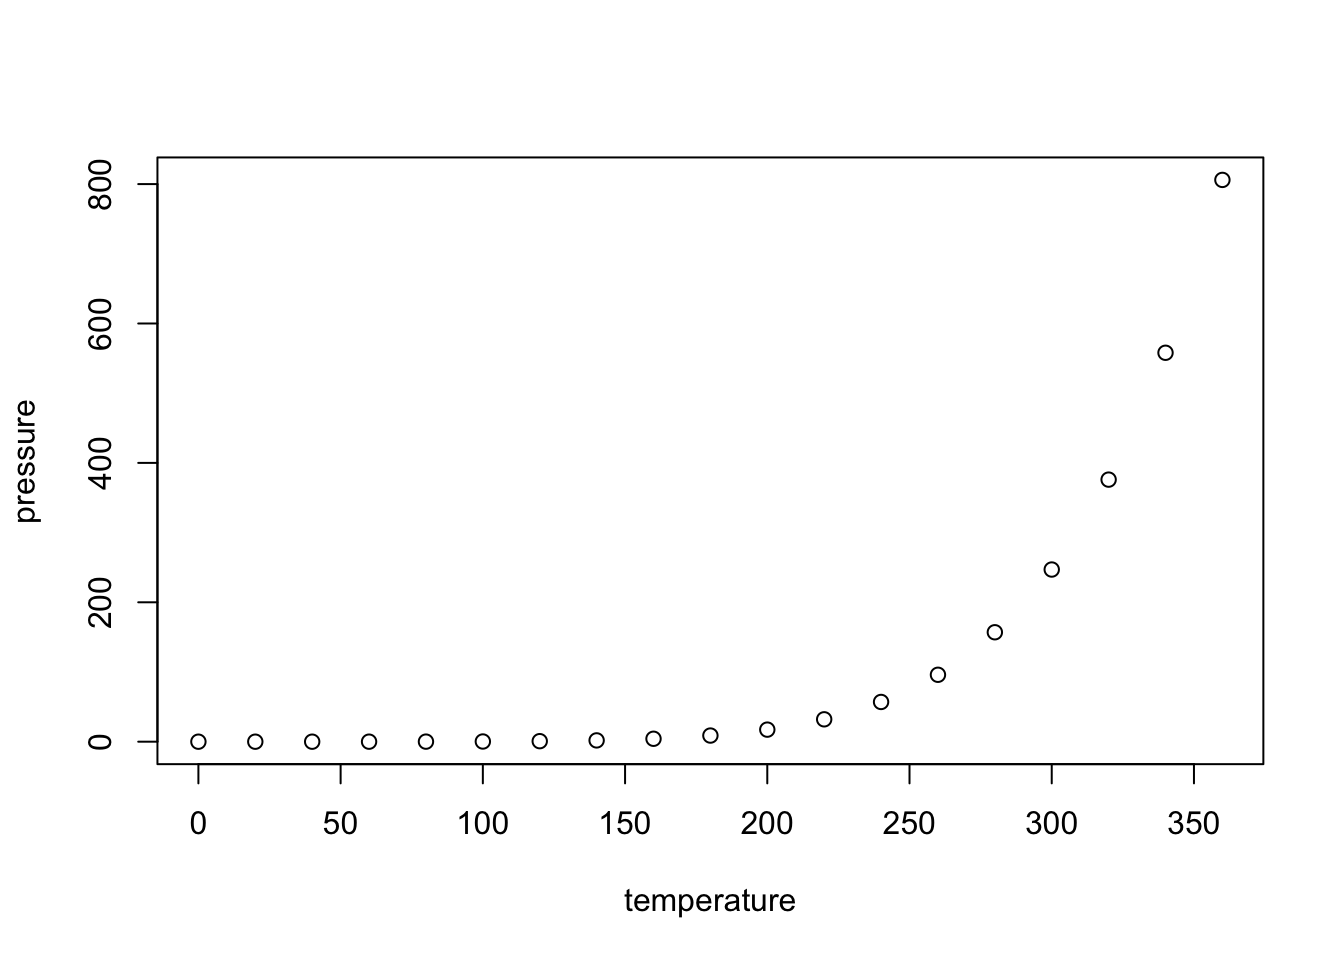
You can also embed plots, for example:

Note that the echo = FALSE parameter was added to the code chunk to prevent printing of the R code that generated the plot.